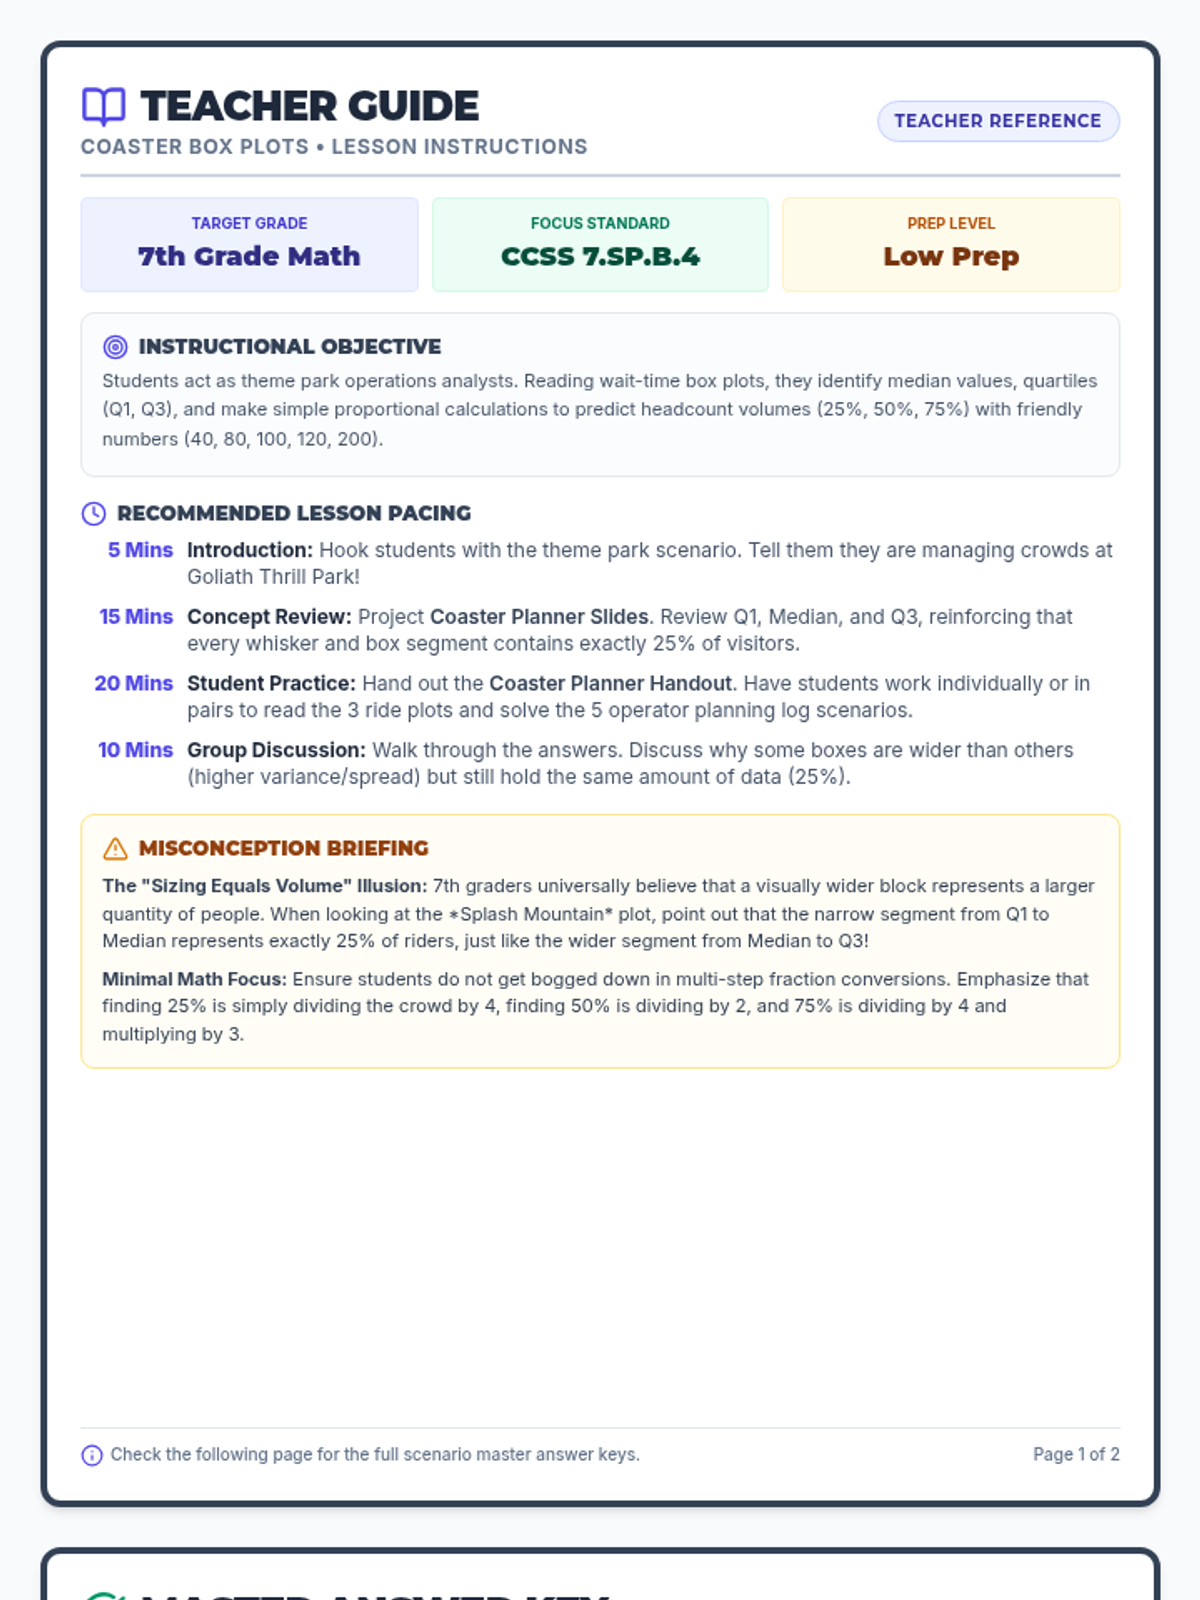
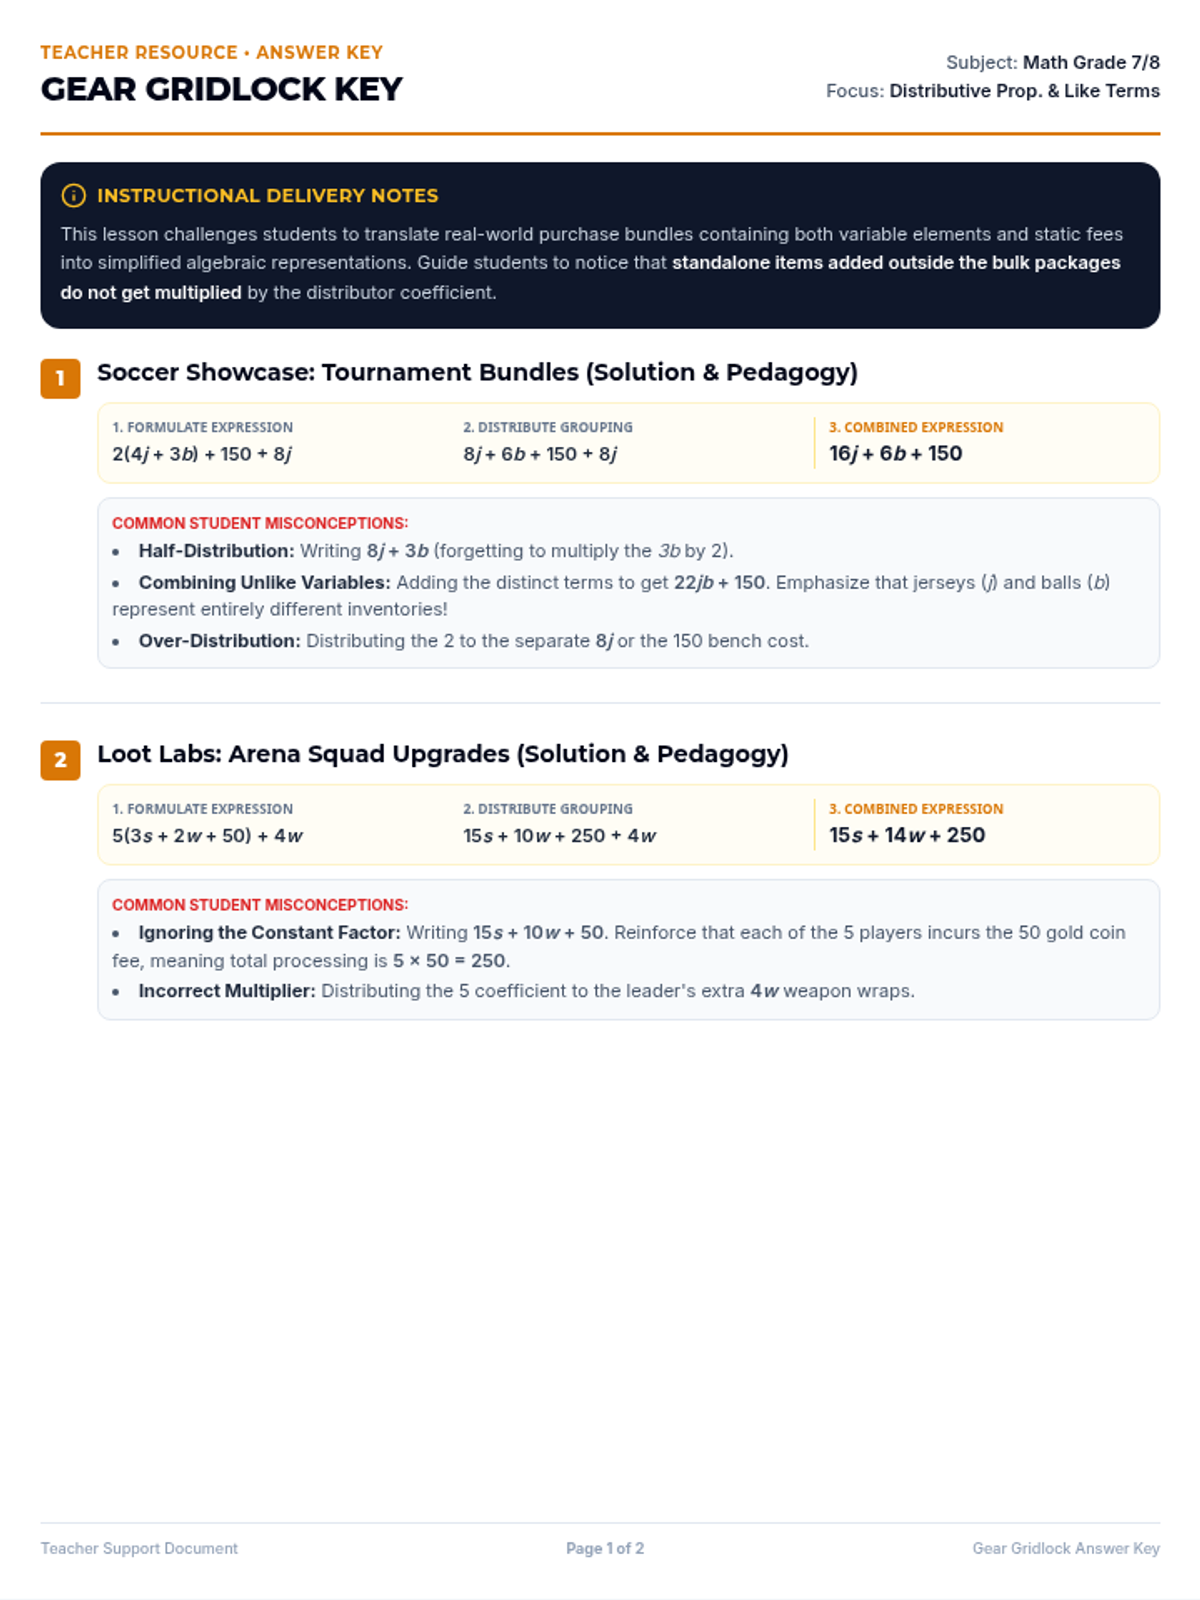
A teacher instruction and resource pack containing step-by-step Interactive Notebook assembly guides, pacing tips, student misconception warnings, and highly detailed answer keys with work shown for both Standard and Support level pages.
A premium 5-slide presentation designed for classroom instruction. Teaches box plot anatomy (focused on the 25% quartile distribution), symmetric vs skewed shapes and their impact on mean/median, and proportional forecasting using the Spring vs. Fall survey scenario.
A 2-page Scaffolded Level Interactive Notebook Spread designed to fit in composition books. Page 1 features guided fill-in-the-blank notes on box plot elements with highlighted 25% regions and ratio table organizers. Page 2 provides scaffolded practice comparing commuter routes and making predictions with custom visual prompts and ratio tables.
A 2-page Standard Level Interactive Notebook Spread designed to fit in composition books. Page 1 features guided notes on the anatomy of box plots (5-number summary, 25% quartiles) and proportional prediction setup. Page 2 provides independent practice comparing two commuter bus route box plots and solving ratio-based prediction problems.
A teacher reference document outlining the Amusement Park Operations lesson plan, pedagogical hints, and the exact answer keys for all 5 student planning scenarios.
An amusement park planning handout where 7th graders read ride wait-time box plots and solve 5 realistic operator scenarios using basic percentage conversions.
A slide deck designed to introduce 7th graders to box plot components and making percentage-based predictions. Explains how the 5-number summary splits data into equal quarters (25%) and shows step-by-step calculations with simple prediction math.
A 2-page workspace log for early finisher students, offering beautifully designed grids, blank workspaces with level badges, and a custom player reflection module to evaluate completed math quest activities.
An engaging, 3x3 retro arcade themed choice board containing creative, real-world, peer-teaching, and logic tasks spanning Algebraic Expressions, Probability, and Ratios. Great for classroom early finishers.
A cohesive 2-page teacher answer key and pedagogical facilitation guide containing step-by-step mathematical breakdowns, simplified expressions, common student errors, and key instructional points for all 4 problems.
An engaging, 2-page math worksheet structured for middle school students to practice distributive property and combining like terms. It contains 4 real-world word problems themed around soccer, video games, customized sneakers, and dirt bikes with dedicated student writing spaces.
A printable set of retro-arcade themed math task cards focusing on mean, median, mode, and range. Designed for IEP accessibility, each card contains single-digit values with simple visual representations, multiple-choice questions with identical styling, and scissor-cut dashed borders.
Retro-arcade themed slides for teaching mean, median, mode, and range to IEP students in a Jeopardy style. Adheres strictly to a minimum 24px font size, includes single-digit examples with visual counters, multiple-choice options with uniform styling, and definition-focused explanations.
A retro-arcade themed recording sheet and score tracker for IEP students playing the Stat Showdown Jeopardy game. Features visual counters, simplified language, and highly accessible multiple-choice options with uniform styling.