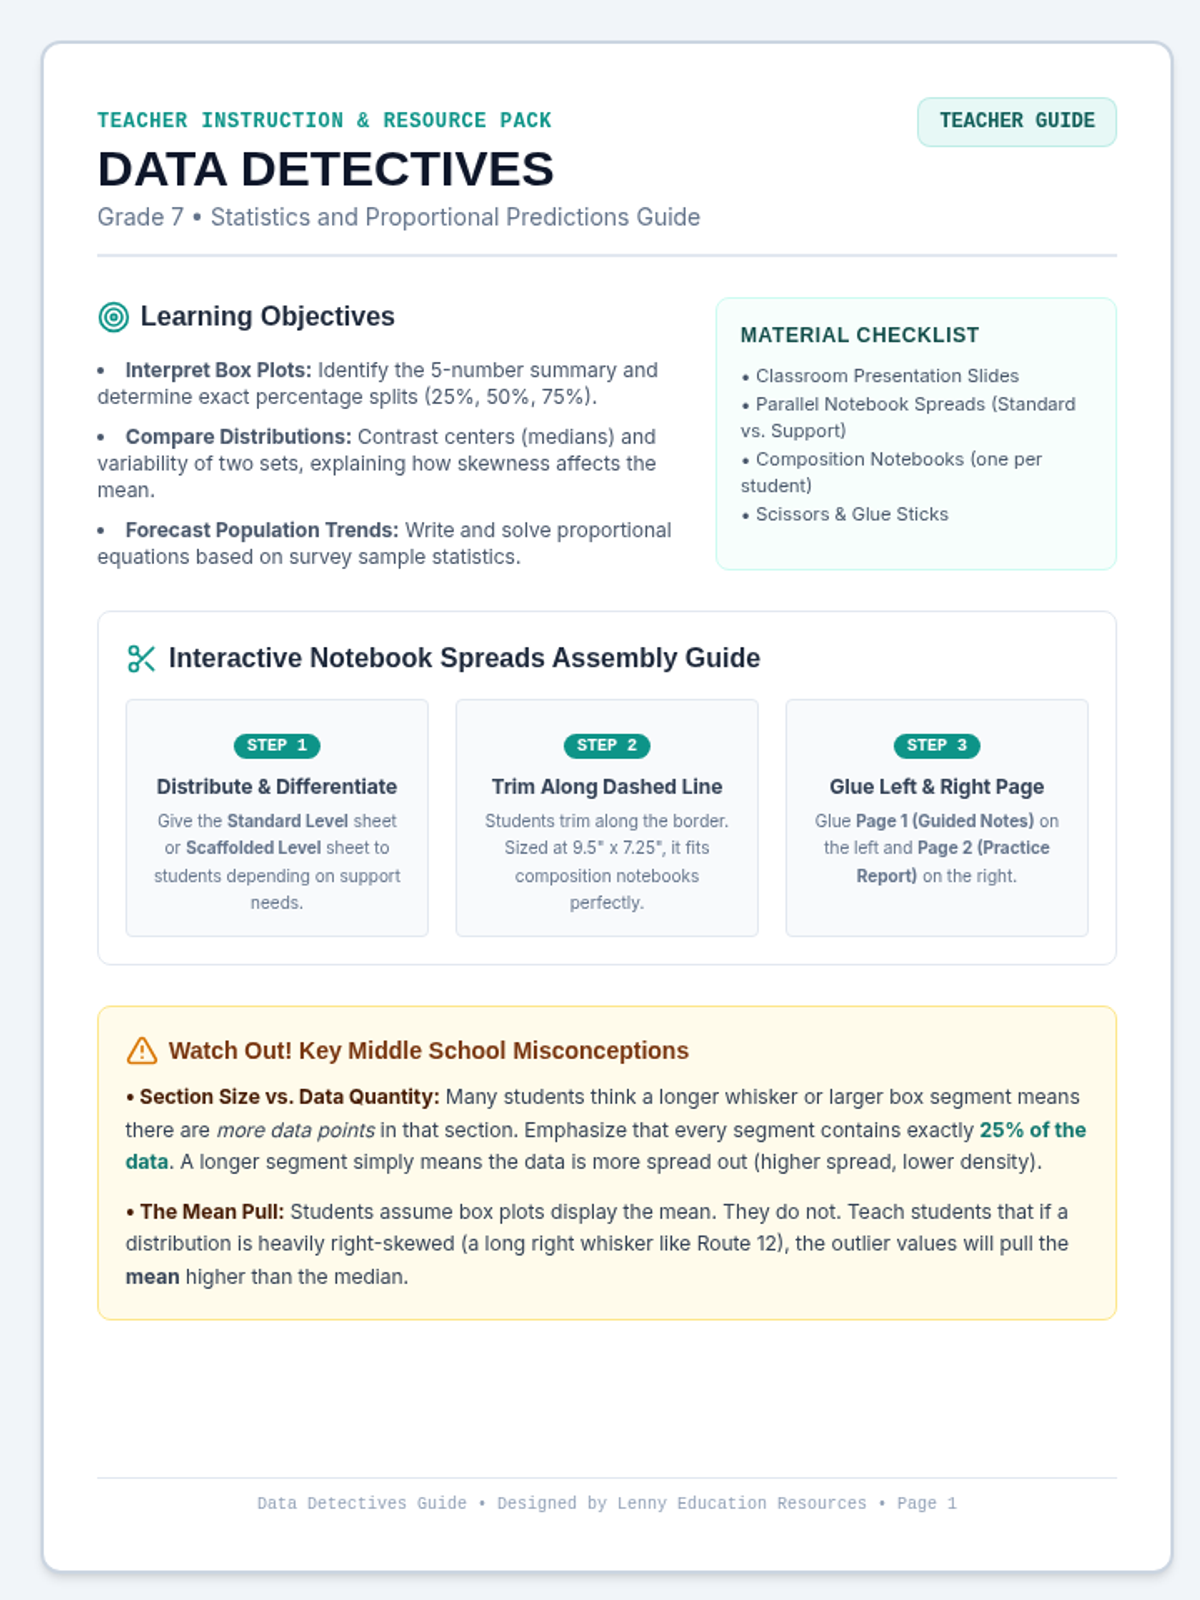
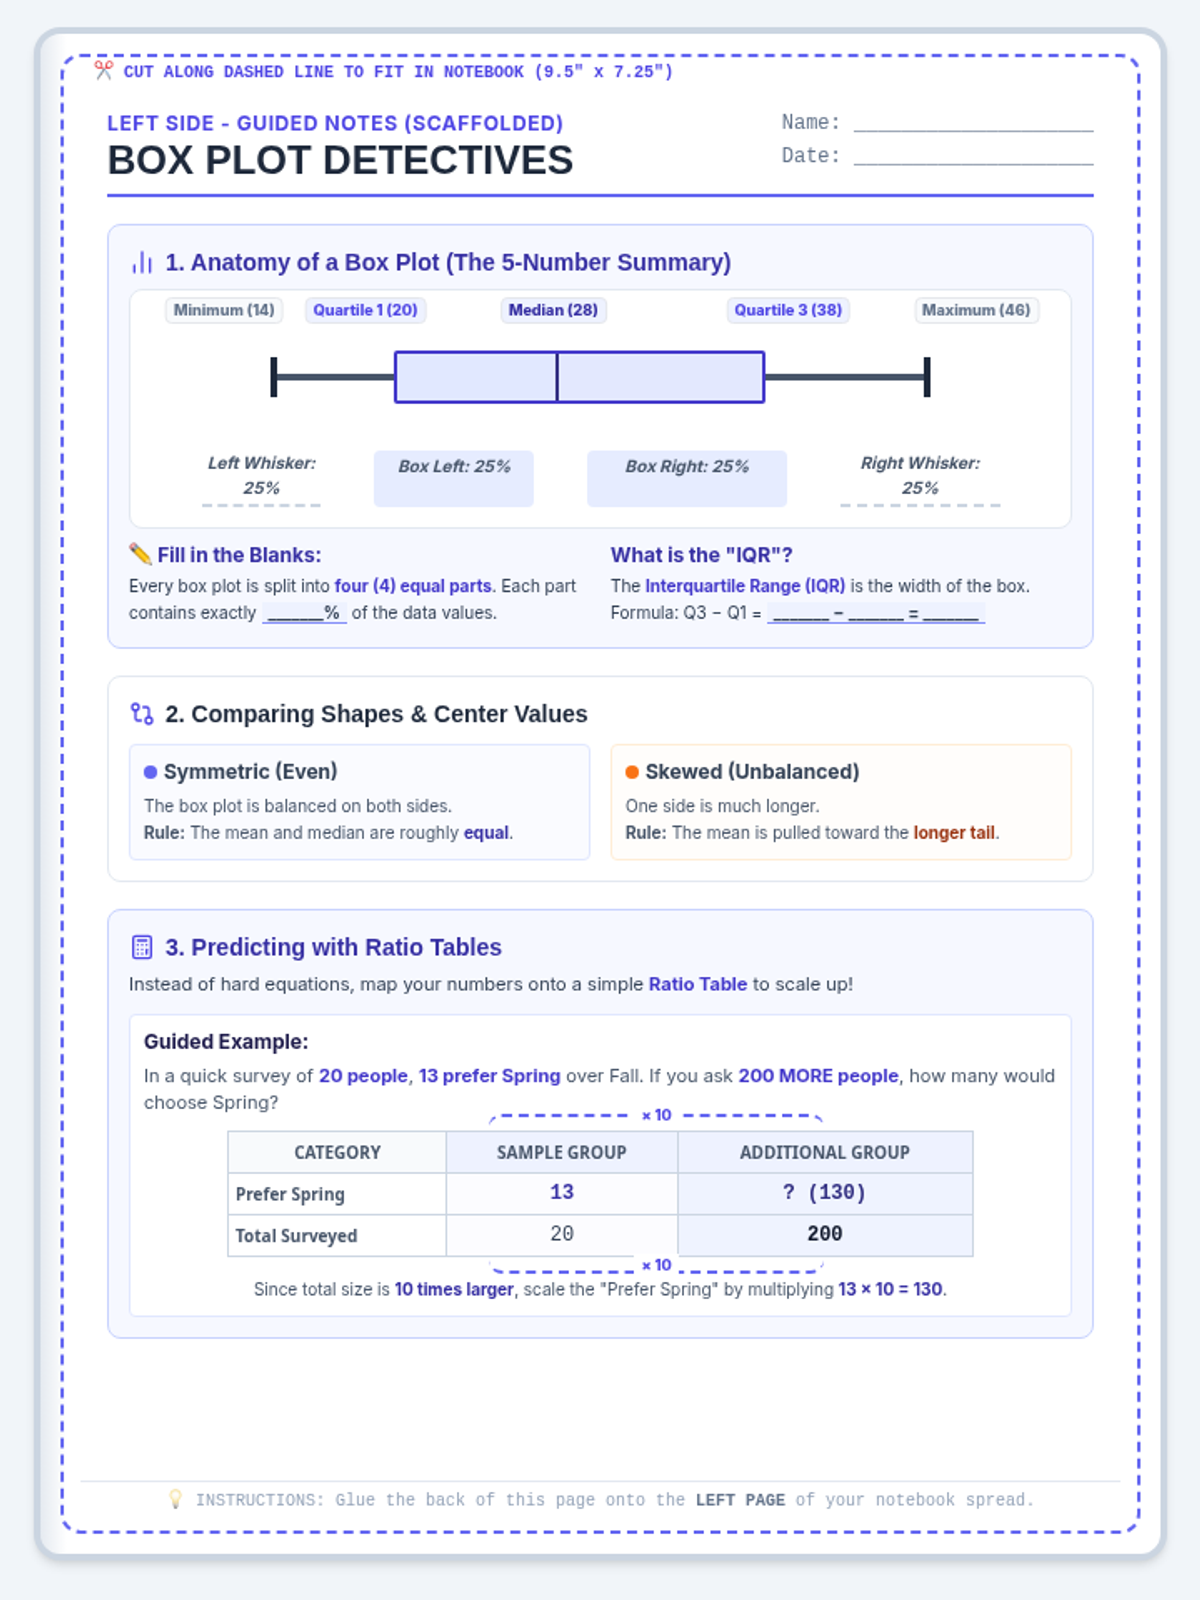
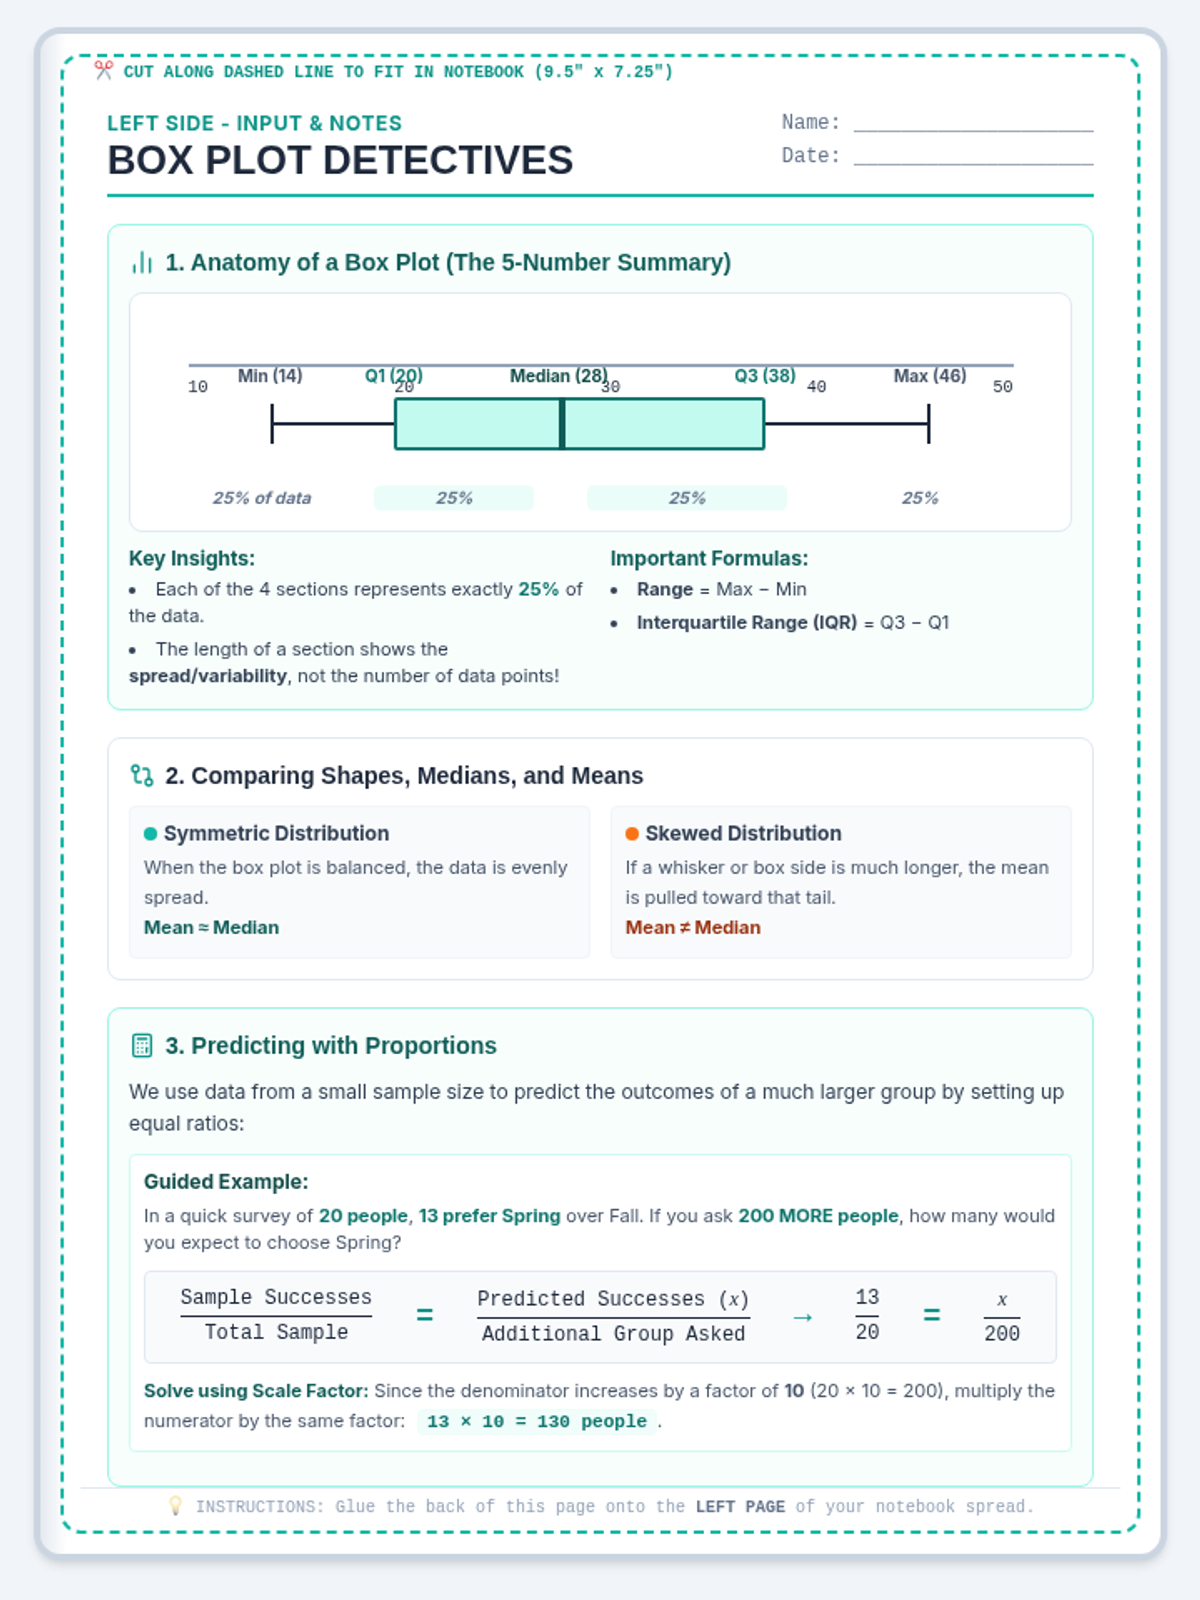
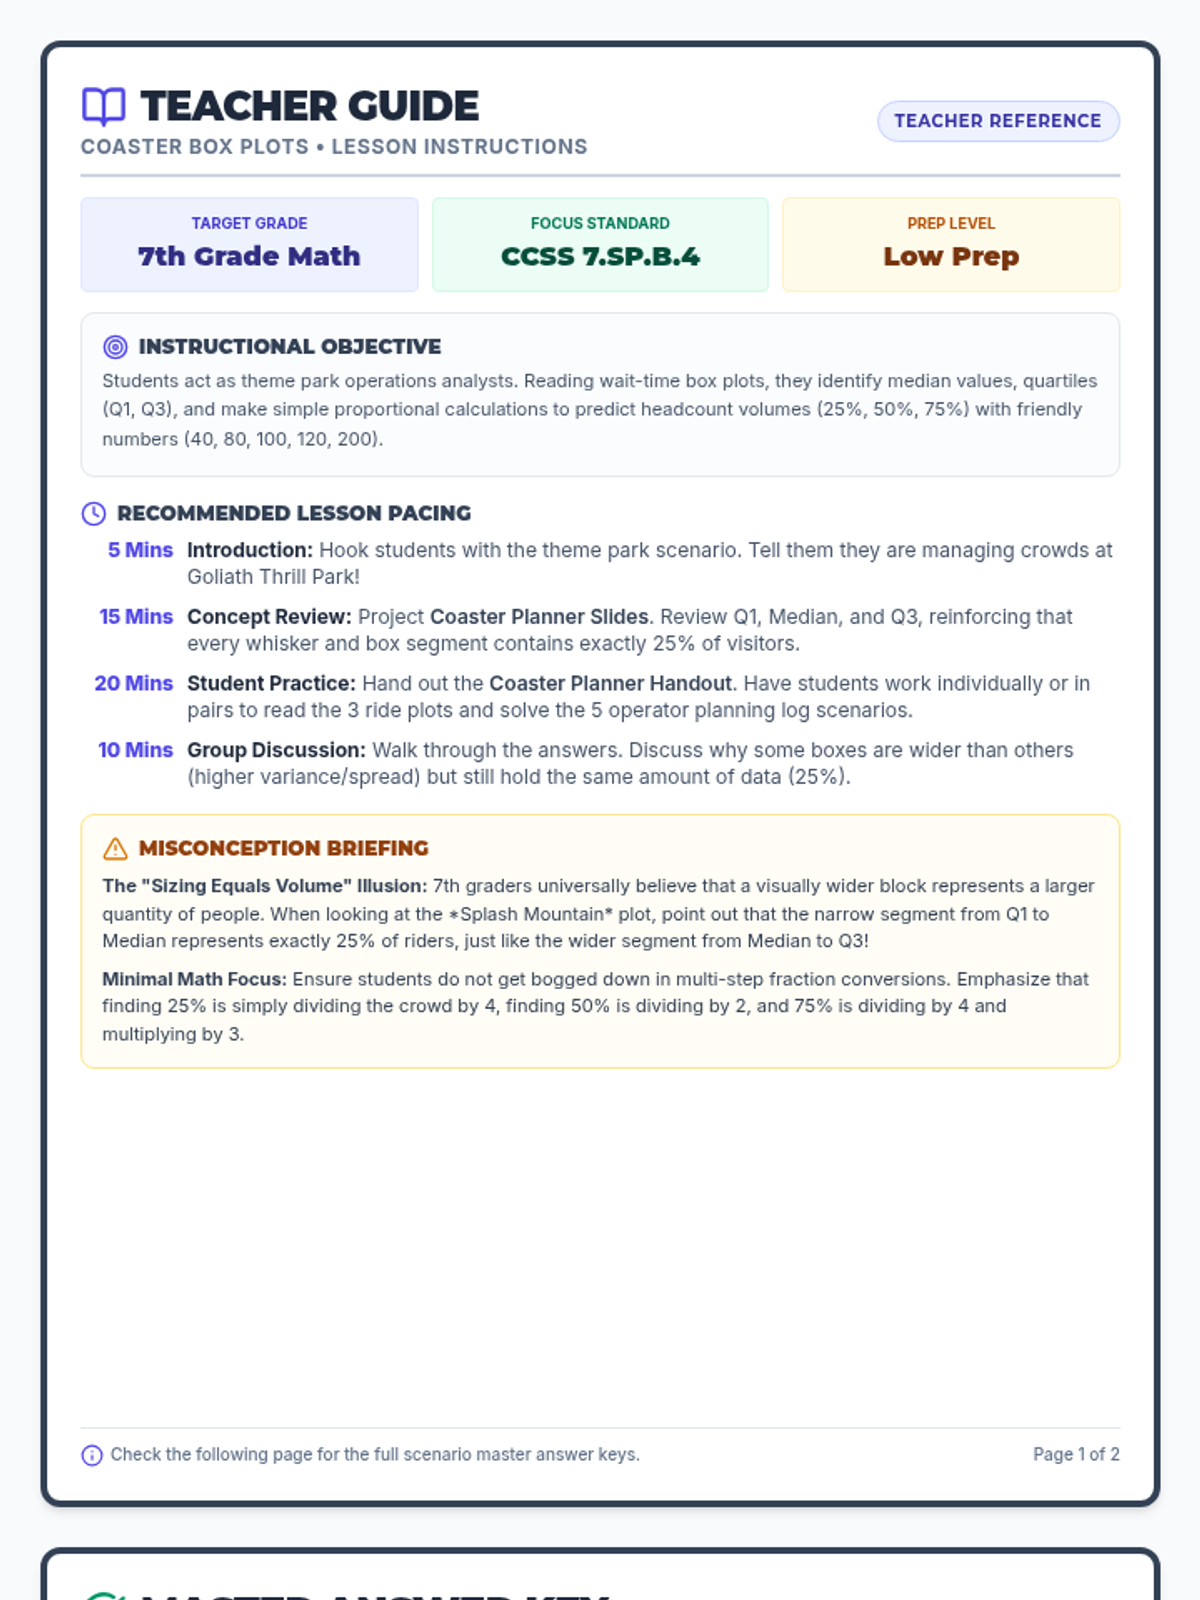
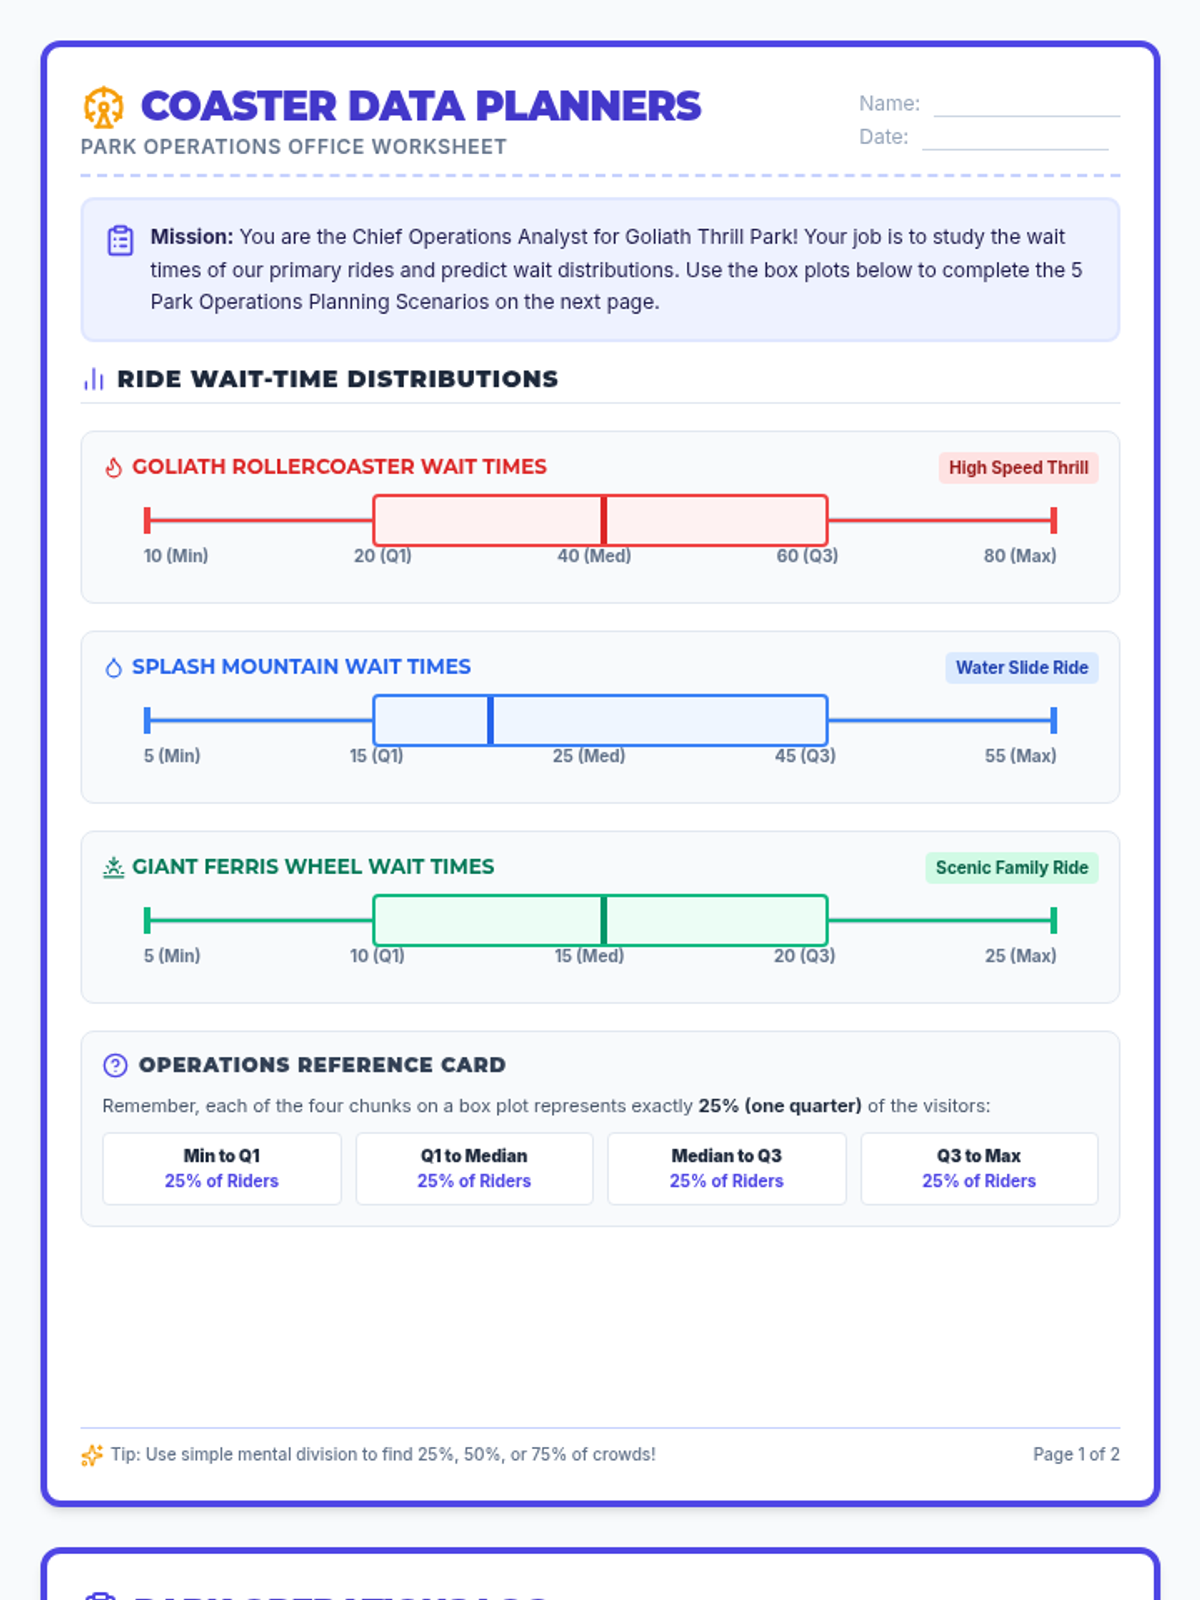
A premium 5-slide presentation designed for classroom instruction. Teaches box plot anatomy (focused on the 25% quartile distribution), symmetric vs skewed shapes and their impact on mean/median, and proportional forecasting using the Spring vs. Fall survey scenario.