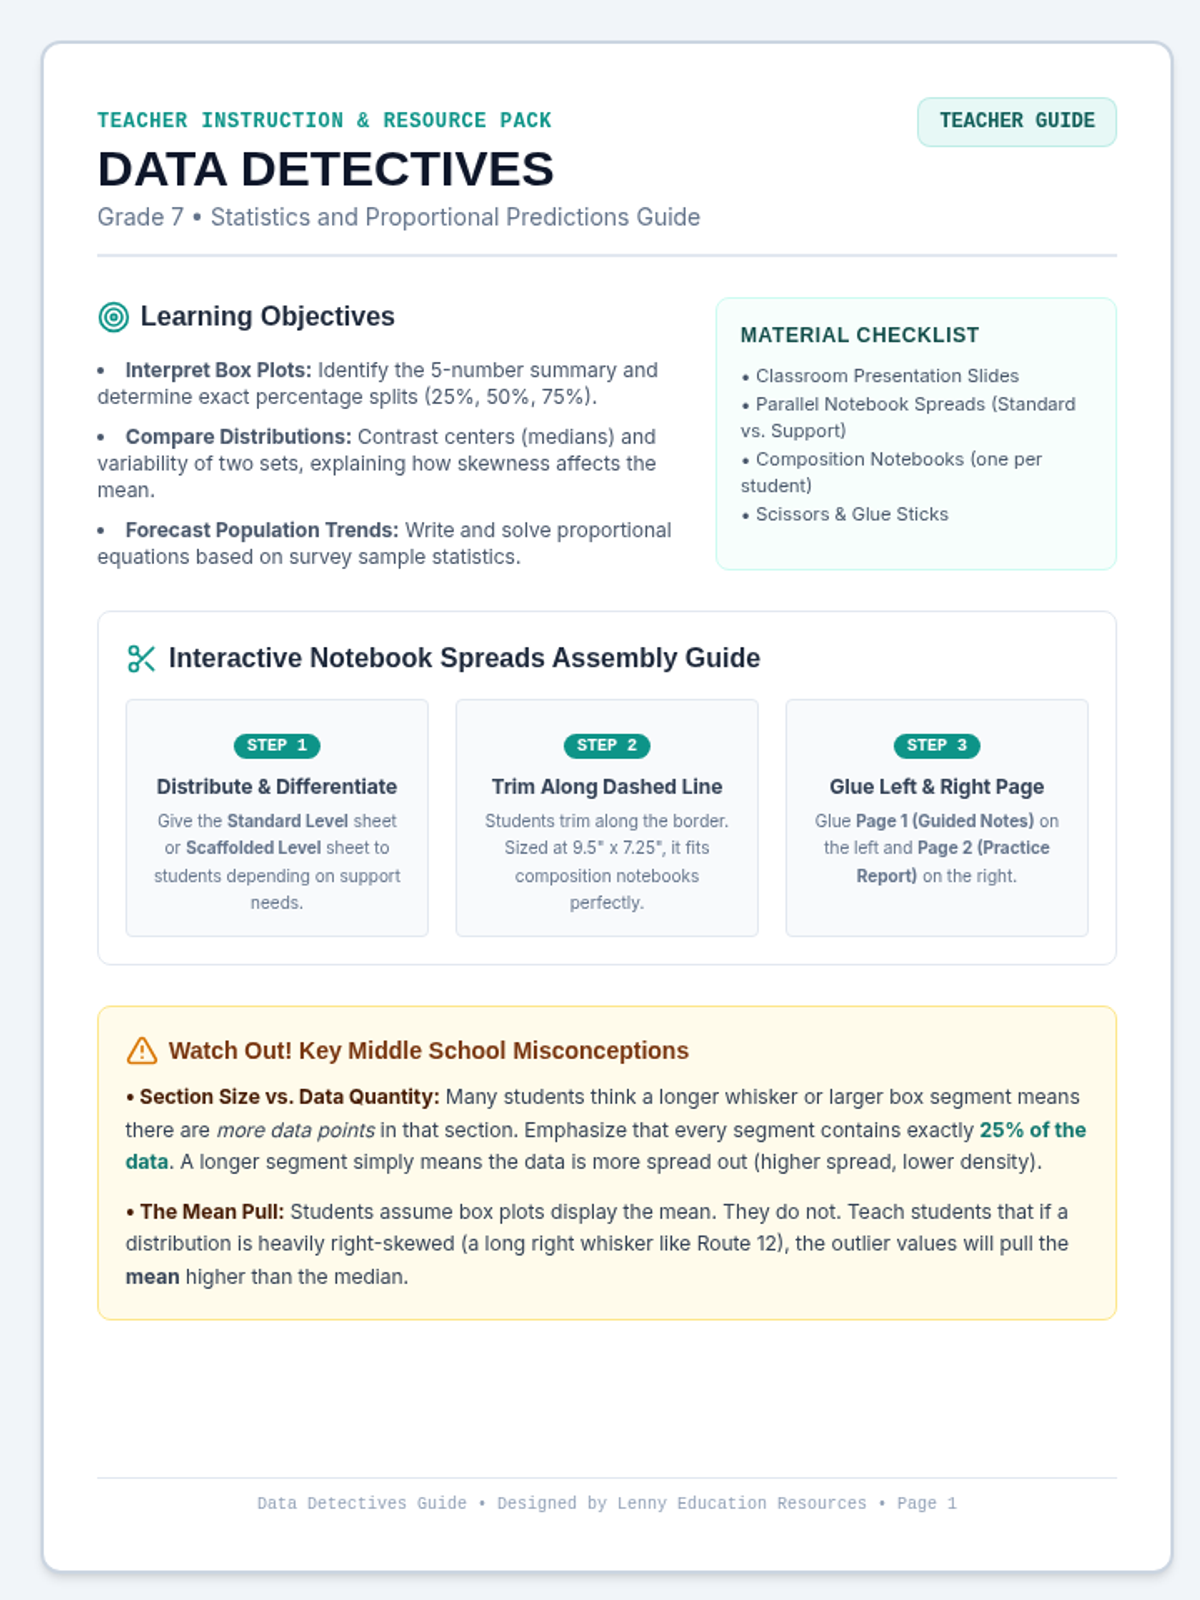
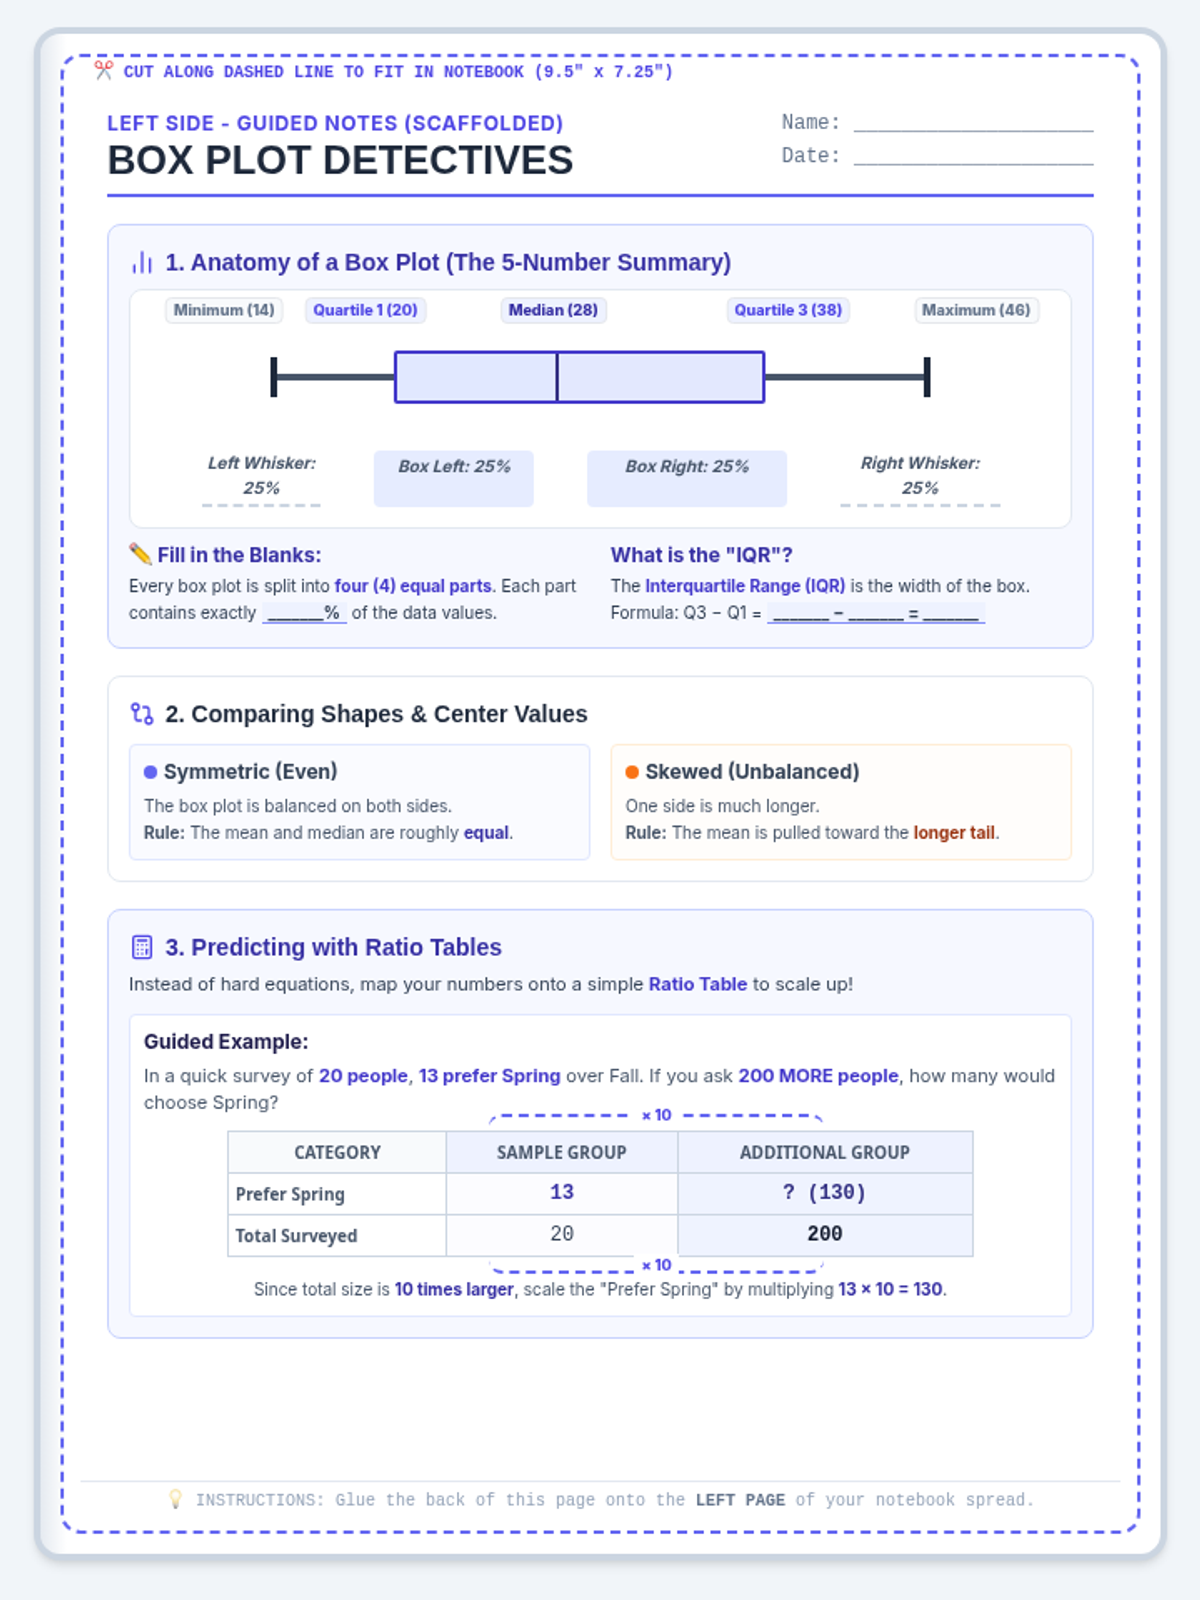
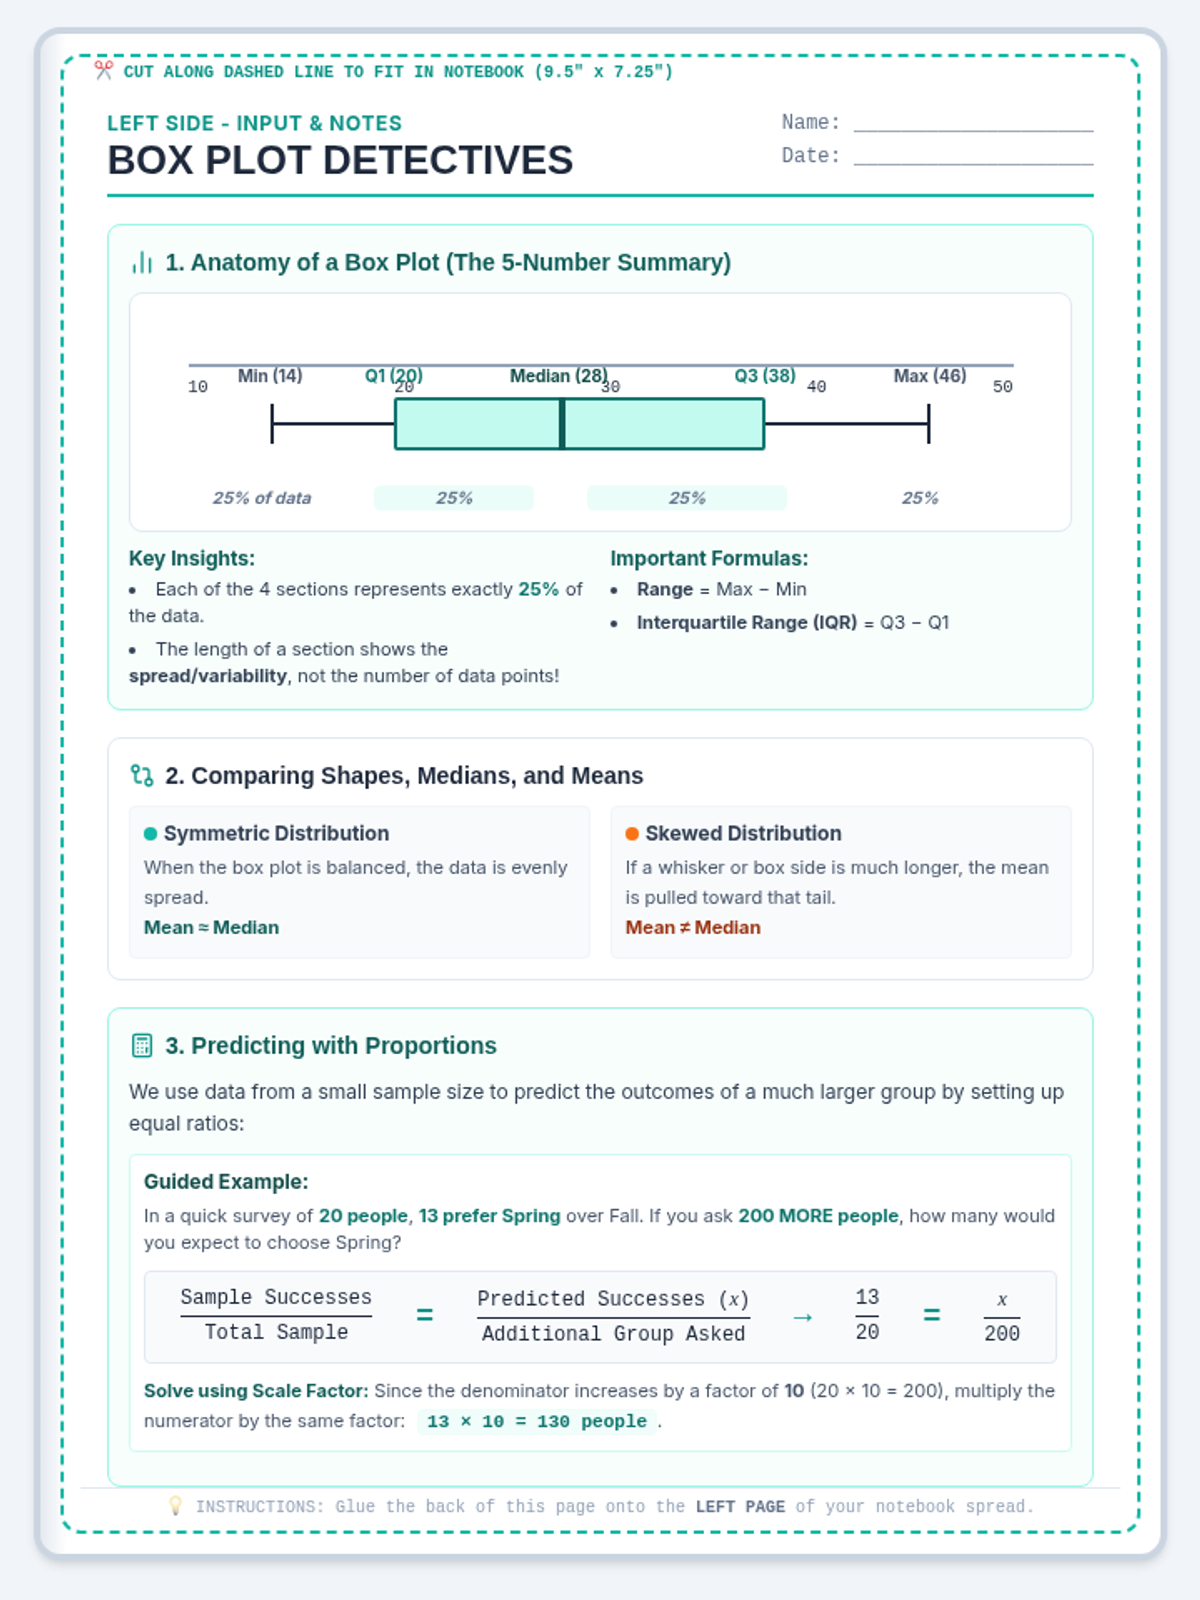
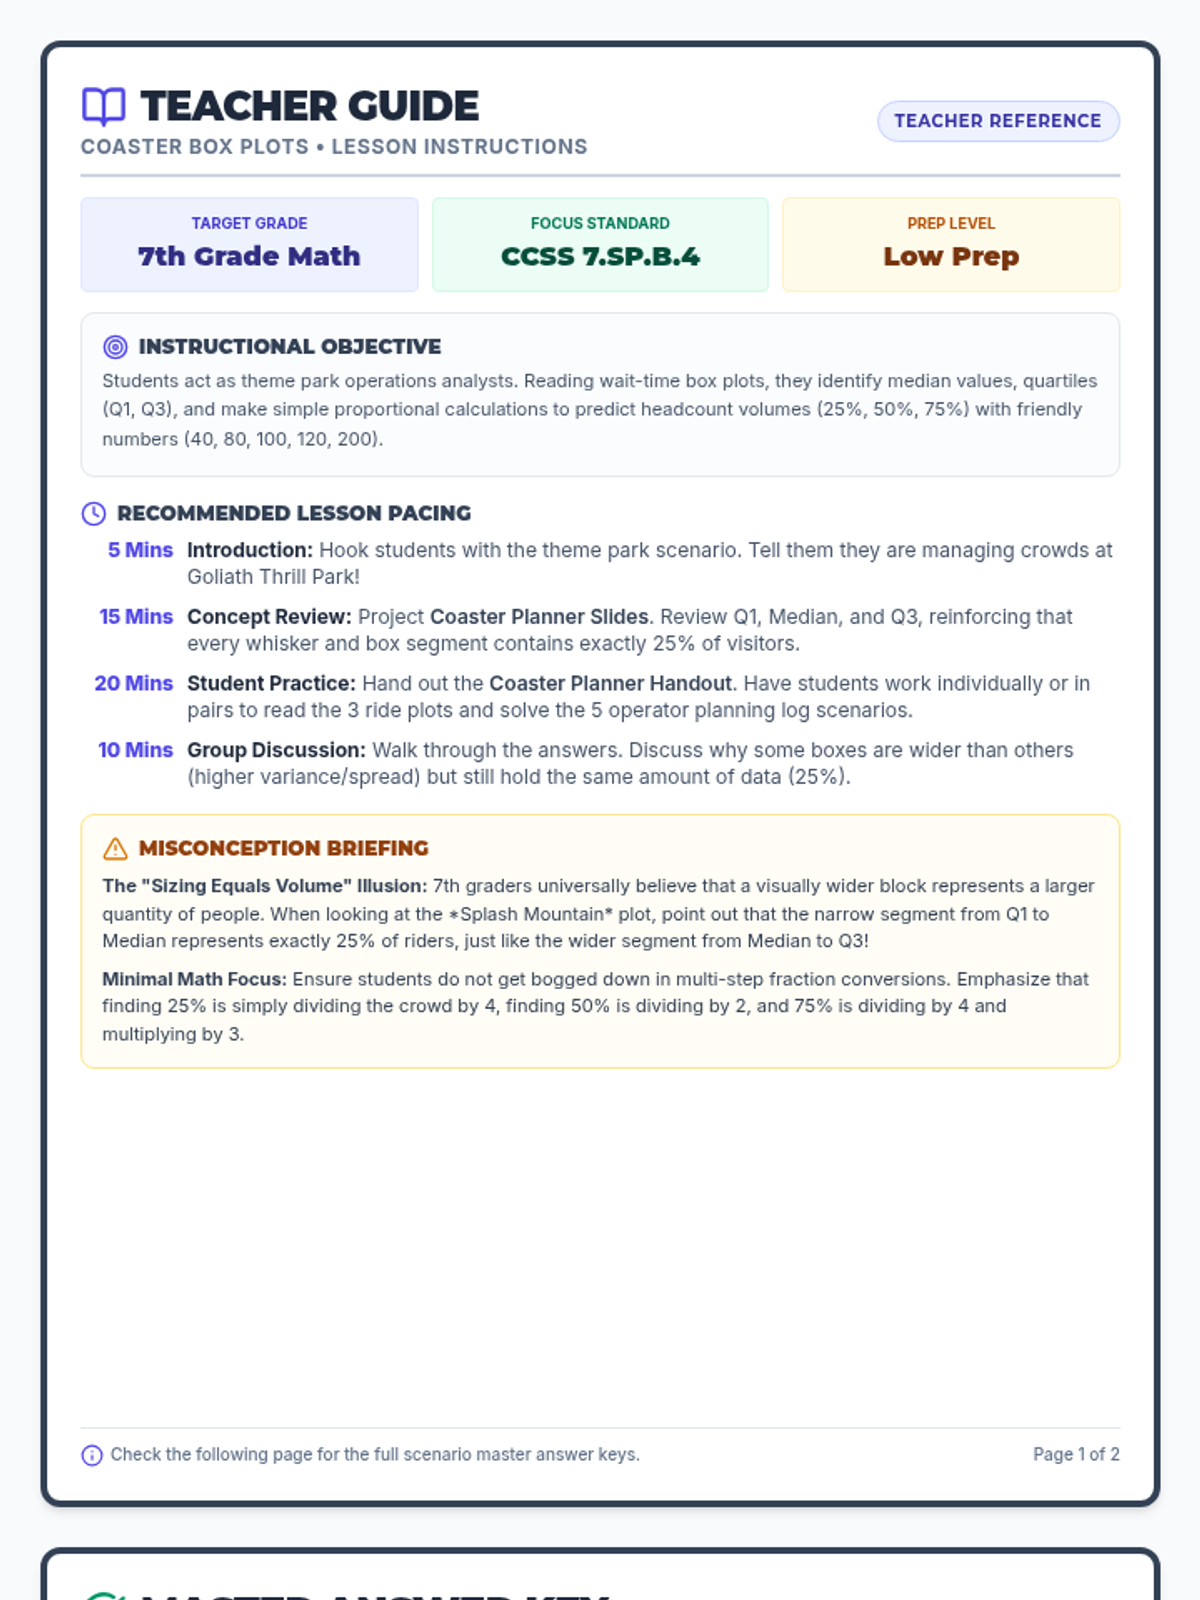
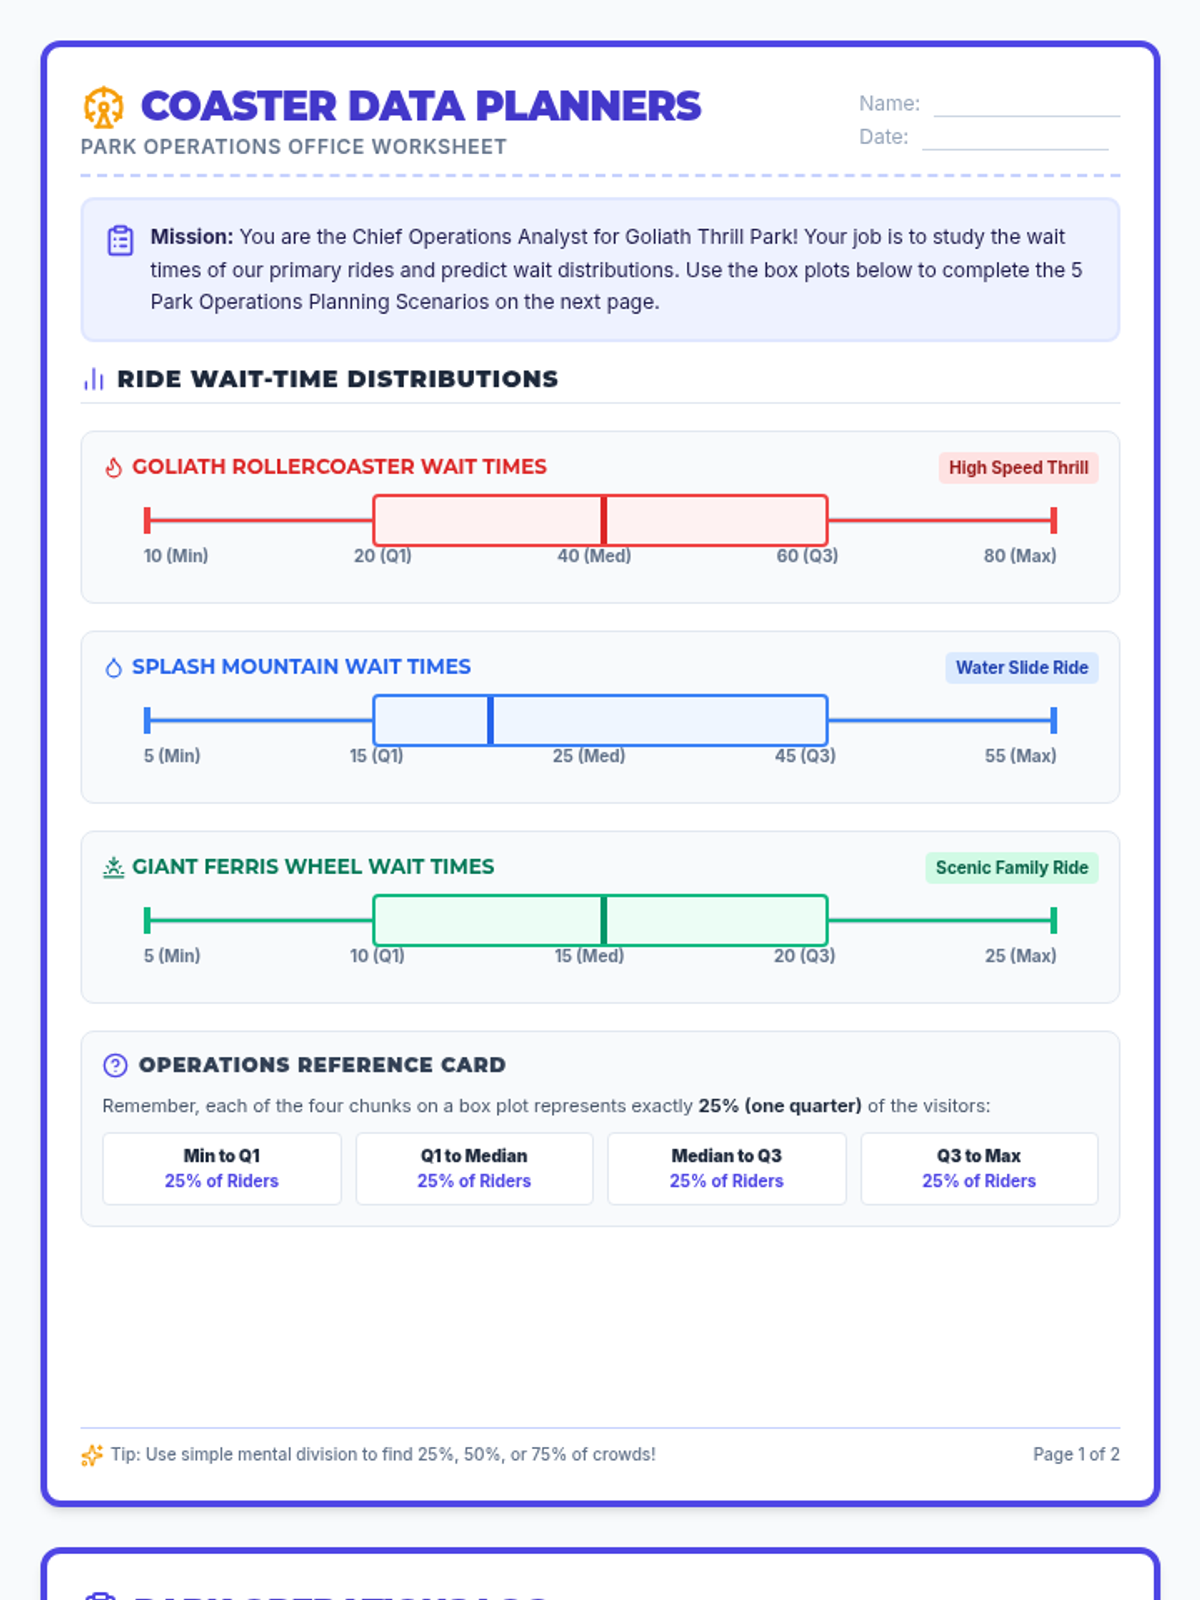
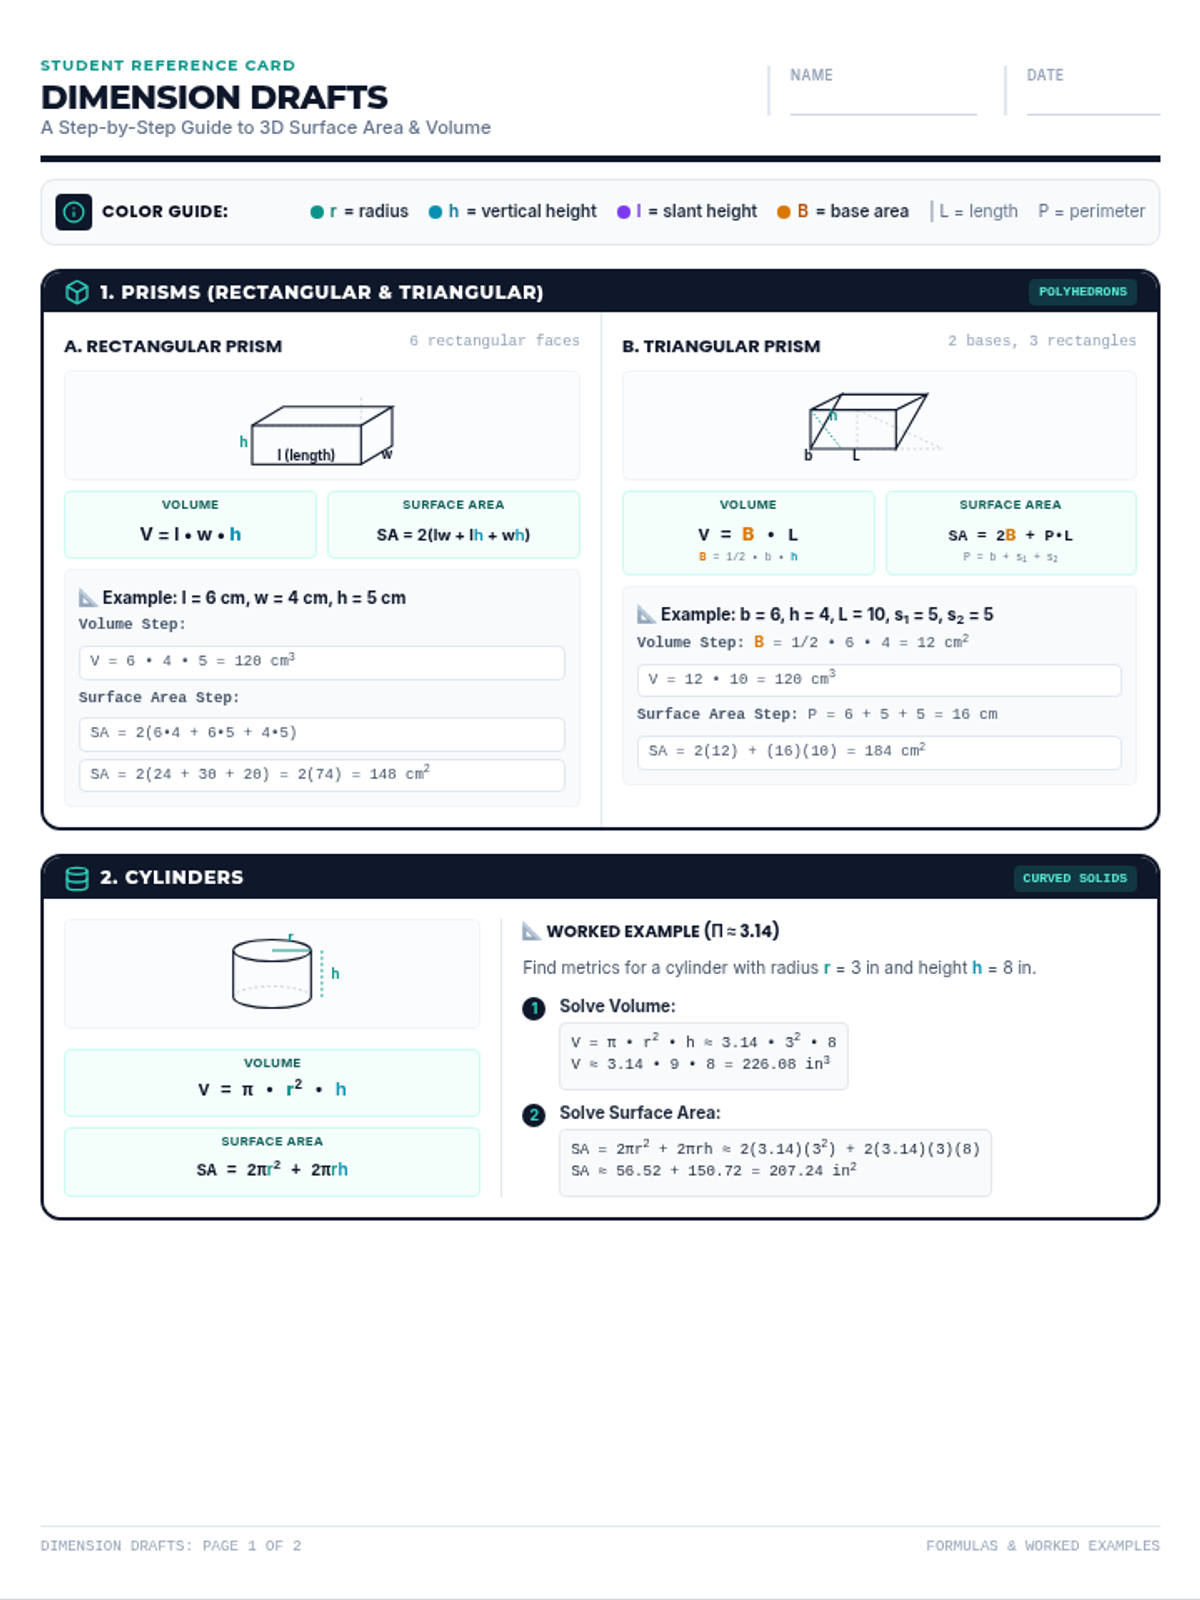
A slide deck designed to introduce 7th graders to box plot components and making percentage-based predictions. Explains how the 5-number summary splits data into equal quarters (25%) and shows step-by-step calculations with simple prediction math.
A slide deck designed to introduce 7th graders to box plot components and making percentage-based predictions. Explains how the 5-number summary splits data into equal quarters (25%) and shows step-by-step calculations with simple prediction math.